Blake Klein · 29 September 2026
Nookwood's School Initiatives and Artist Collaborations Uncover Hidden Links Between Local Biodiversity Data and Regional Flood History
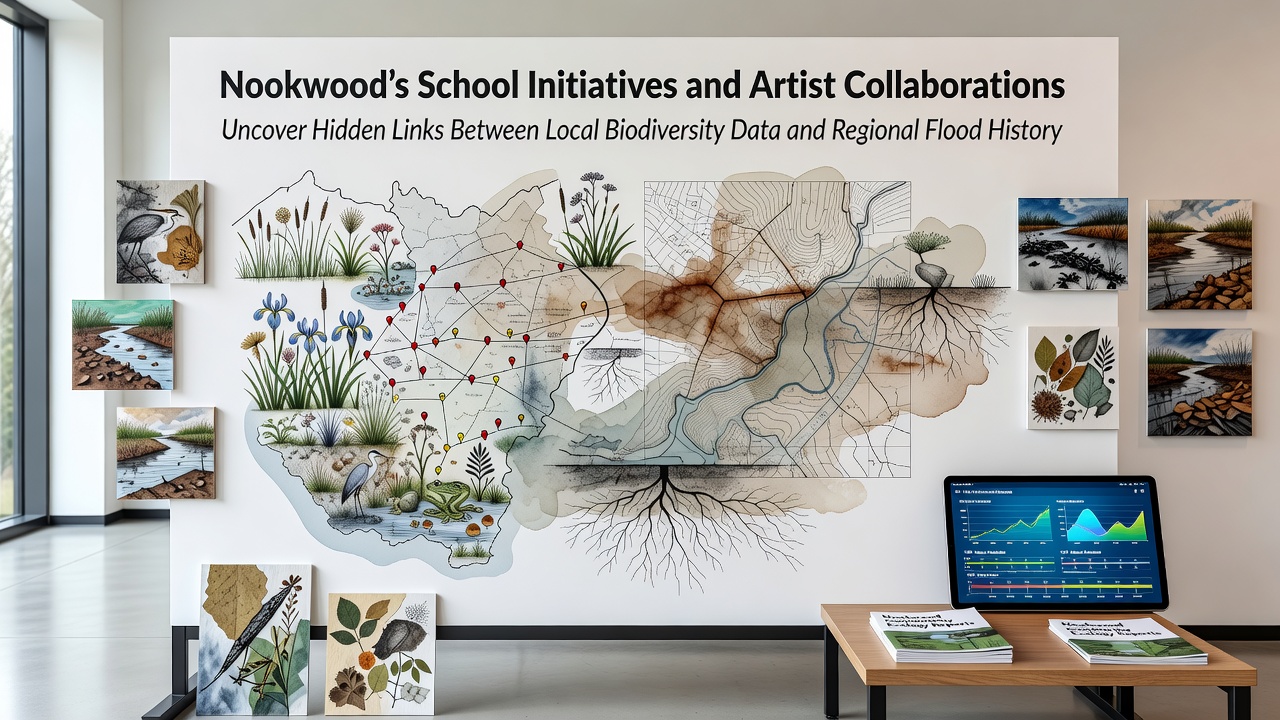
Schools across the Nookwood region have rolled out hands-on programs that pair students with local artists to examine biodiversity records alongside flood archives, and these efforts have started revealing connections that stretch back decades. Teachers integrated field data collection into science curricula while artists translated the numbers into visual timelines, creating exhibits that highlight shifts in plant and animal populations during past flood events. The work draws on datasets spanning from the 1970s onward, showing how certain wetland species declined after major inundations while others expanded in the altered terrain.
School Programs Build Data Collection Skills
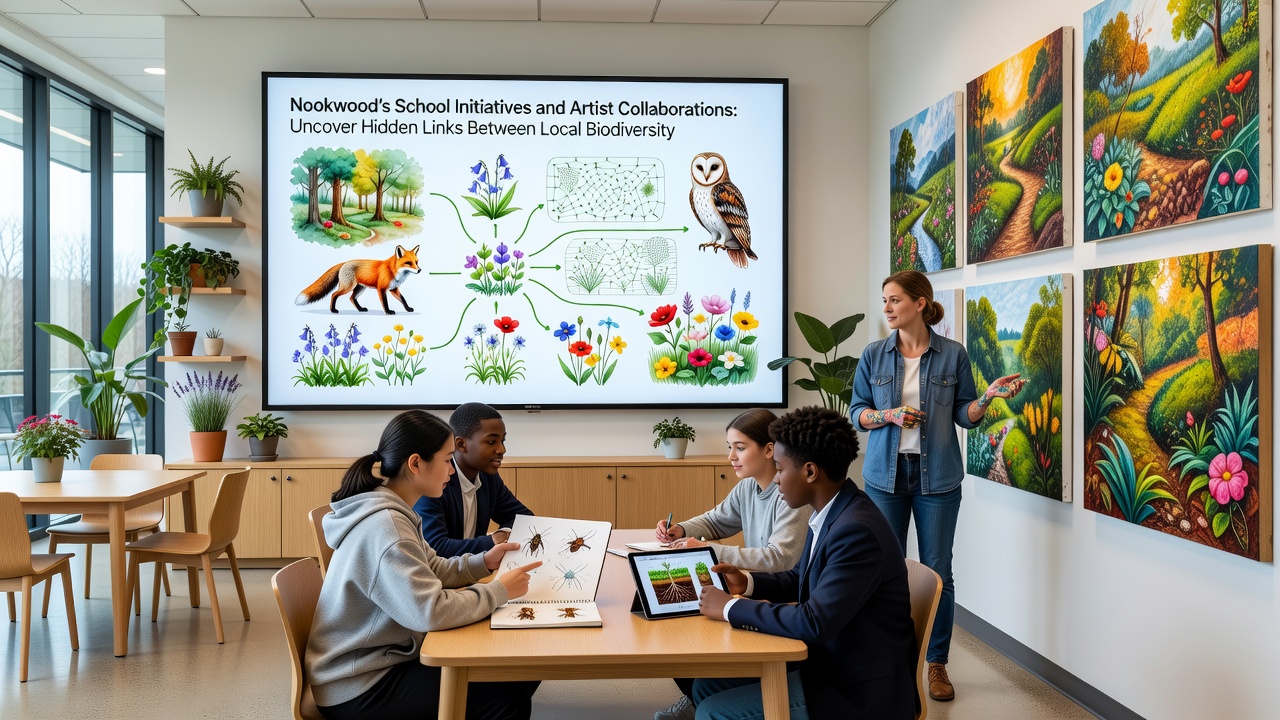
Local middle and high schools launched monitoring projects in 2024 that require students to track species counts, water quality metrics, and vegetation changes at fixed sites along the Nookwood river corridor, and these same students cross-reference their observations with municipal flood logs from the same periods. Classes visit sites monthly to record everything from amphibian presence to soil saturation levels, then upload results into a shared regional database managed by the county environmental office. Teachers report that participation has grown steadily, with over 300 students contributing entries by mid-2025, and the accumulated records now cover enough seasons to spot trends that single-year studies miss.
Artist Collaborations Turn Numbers Into Visual Stories
Artists working with the schools have produced installations that overlay biodiversity charts onto maps of historical flood extents, and these pieces appear in community centers and at regional fairs where residents can trace how certain bird populations shifted after the 1987 and 2003 events. One group created a series of layered prints that show tree ring data next to rainfall totals, allowing viewers to see correlations between wet years and changes in understory plant diversity. The collaborations extend into digital formats as well, with interactive projections that animate species movement patterns during simulated flood sequences drawn from archived water level measurements.
Data from these combined efforts points to specific relationships, such as reduced populations of certain aquatic insects in areas that experienced prolonged flooding followed by rapid drainage, while invasive plant species gained ground in the disturbed zones. Researchers at nearby universities have begun incorporating the student-collected records into larger models, noting that the fine-grained local observations fill gaps left by broader satellite surveys. The artist visualizations have helped communicate these patterns to non-specialists, prompting additional community volunteers to submit their own historical photographs and notes that further enrich the dataset.
September 2026 Data Release Expands the Picture
Plans call for a public data release in September 2026 that will include three additional years of student observations paired with updated flood modeling from the regional water authority, and organizers expect this release to strengthen the identified links between biodiversity changes and flood frequency. The event will feature new installations by the collaborating artists alongside workshops where participants can add their own observations to the growing archive. Preliminary analysis already suggests that areas with higher pre-flood species diversity recovered more quickly after the 2018 event, a pattern that aligns with findings from similar studies conducted in other temperate watersheds.
Connecting Local Records to Wider Patterns
Cross-checks with records maintained by the U.S. Geological Survey have confirmed that Nookwood flood peaks correspond with regional precipitation anomalies tracked across the Midwest, while biodiversity responses match patterns documented in long-term ecological research stations elsewhere in the country. European datasets from the European Environment Agency provide comparative context, showing how similar river systems in the UK and Germany exhibit parallel species shifts after comparable flood sequences. These external references help place Nookwood findings within broader climate and land-use discussions without requiring residents to travel for context.
Conclusion
The ongoing integration of school-collected biodiversity data with regional flood histories continues to produce new insights, and the artist collaborations ensure these findings reach wider audiences through accessible formats. As the September 2026 release approaches, additional layers of historical and contemporary information will likely refine the understanding of how local ecosystems respond to water events over time. The programs demonstrate one way communities can build detailed environmental records while engaging younger residents and creative practitioners in the process.